For media buyers, creative strategists and founders who judge video ads on Meta
Creative analytics: 6 metrics and their formulas
Creative analytics measures each ad on its own, with six numbers. Hook rate is 3-second video plays divided by impressions. Hold rate is ThruPlays divided by 3-second video plays. CTR is link clicks divided by impressions. CPM is amount spent divided by impressions, times 1,000. Cost per result is amount spent divided by results, and ROAS is purchase value divided by amount spent. The numbers show where viewers leave an ad. They do not show what was on screen at that second, which is why the video itself has to be read.
Published 9 min read
The short version
- Hook rate is 3-second video plays divided by impressions, and it judges the first 3 seconds of the ad.
- Hold rate is ThruPlays divided by 3-second video plays, and it judges seconds 3 to 15.
- 2 of the 6 metrics, hook rate and hold rate, are not columns in Ads Manager. You build them from 3 metrics Meta does report.
- Meta counts a 3-second play at 97 per cent of the length for a video shorter than 3 seconds, and replays count in neither video metric.
- Every one of the 6 numbers says where a viewer left. 0 of them says what was on screen at that second.
What is on this page and on no other
Every page about these products carries the same prices and the same feature lists. These are the facts this one produced itself, and how each one was made.
2 of the 6 creative metrics, hook rate and hold rate, are not reported by Meta. Both are divisions of 3 metrics Meta does report: impressions, 3-second video plays and 15-second ThruPlays.
Meta's definitions of 2 of the 6 metrics, cost per result and website purchase ROAS, say the number may be estimated, and that statistical modelling may fill in results that cannot be measured directly.
Meta counts a play by how much of the video was played, not by the time that passed: a 3-second play needs 3 seconds or 97 per cent of a shorter video, a ThruPlay needs 15 seconds or 97 per cent of a shorter video, and 0 seconds of replay count.
The six metrics of creative analytics
Four come straight from Ads Manager. Two you divide yourself.
| Metric | Formula | Meta columns | What it judges |
|---|---|---|---|
| Hook rate | 3-second video plays ÷ impressions | 3-second video plays, Impressions | Seconds 0 to 3: did the opening stop the scroll |
| Hold rate | ThruPlays ÷ 3-second video plays | 15-second ThruPlays, 3-second video plays | Seconds 3 to 15: did the middle keep them |
| CTR (link) | Link clicks ÷ impressions | CTR (link click-through rate) | The ask: did the ad send people to the page |
| CPM | Amount spent ÷ impressions × 1,000 | CPM (cost per 1,000 impressions) | The auction: what 1,000 views cost |
| Cost per result | Amount spent ÷ results | Cost per result | The whole ad against your objective |
| ROAS | Purchase conversion value ÷ amount spent | Website purchase ROAS | The money: value back per unit spent |
The definitions come from Meta's own pages: 3-second video plays, 15-second ThruPlays, CTR (link click-through rate), CPM, cost per result and website purchase ROAS, all read on 26 September 2026.
Hook rate is also called thumb-stop ratio. Both names mean the same division. Some teams divide by reach instead of impressions, which gives a higher number for the same ad, so write down which one you use before you compare two reports.
A worked example, from raw numbers to the six metrics
Round numbers, made up for the arithmetic, so you can check each step.
| Raw number | Value | Metric | Result |
|---|---|---|---|
| Impressions | 100,000 | Hook rate | 28,000 ÷ 100,000 = 28% |
| 3-second video plays | 28,000 | Hold rate | 7,000 ÷ 28,000 = 25% |
| ThruPlays | 7,000 | CTR (link) | 900 ÷ 100,000 = 0.9% |
| Link clicks | 900 | CPM | $1,500 ÷ 100,000 × 1,000 = $15 |
| Amount spent | $1,500 | Cost per purchase | $1,500 ÷ 45 = $33.33 |
| Purchases, and their value | 45, $4,050 | ROAS | $4,050 ÷ $1,500 = 2.7 |
Read the example from the top. 72 per cent of the impressions left before second 3, so the opening is the first place to look. Of the viewers who stayed, 75 per cent left before second 15. The ad still made 2.7 times its spend. The numbers say where the ad lost people. They cannot say what the ad showed at second 2, or what it said at second 9, because an Ads Manager column holds a count and no picture.
The question the numbers cannot answer
Every metric points at a window of seconds. The video tells you what is in it.
| A low number in | Look at these seconds | What to read there |
|---|---|---|
| Hook rate | 0 to 3 | The first frame, the first words, the first text on screen, and when the first face appears |
| Hold rate | 3 to 15 | The beat after the hook: is it a demonstration, a claim, or a pause, and how often does it cut |
| CTR (link) | The last beat | The ask: what it promises, when it appears, and how long the offer stays on screen |
| Cost per result and ROAS | The whole ad | When the product first appears, and every claim the ad makes |
This is the step most creative analytics stops at. A report ranks the ads, and then a person opens the winner, plays it, pauses at each cut and writes down what happens. For 20 ads that is the afternoon.
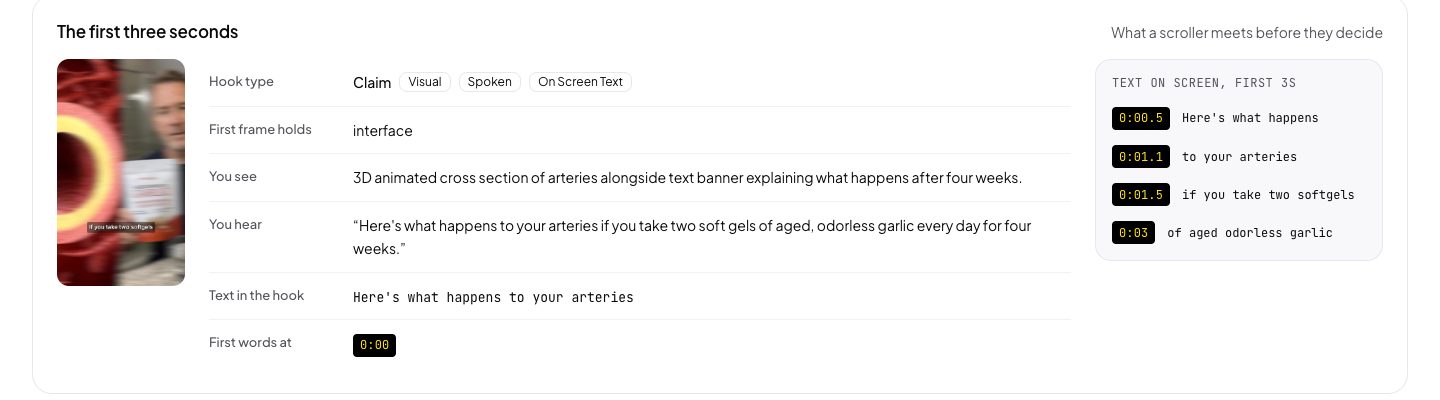
Playhead does that step. Paste the link of an ad, your own or a competitor's, and the answer is a teardown: the hook and how it reaches a viewer, every beat with its start and length, every claim quoted at the second it is legible, the cuts, the first face and the first product, and whether the ad works with the sound off. Put that beside the metric and a low hold rate becomes a sentence you can brief an editor with.
How to use the numbers and the video together
Five steps, one afternoon, and a brief at the end.
Add the columns in Ads Manager
Impressions, 3-second video plays, 15-second ThruPlays, CTR (link click-through rate), CPM, cost per result and website purchase ROAS, at the ad level.
Divide for hook rate and hold rate
Export the table and add two columns: 3-second video plays ÷ impressions, and ThruPlays ÷ 3-second video plays.
Pick the extremes
Take the 3 ads with the best hook rate and the 3 with the worst, from ads with enough impressions to trust the ratio.
Read the 6 ads as one set
Paste the 6 links into Playhead as one set. Each ad is read blind to the others, and the set shows the same fields for each ad side by side.
Write the brief from the rows that differ
Where the winners and the losers disagree, for example the first face at 0 seconds against 4, is where the next test goes.
The verdict
The six numbers are the right place to start and the wrong place to stop. Hook rate and hold rate point at seconds 0 to 3 and 3 to 15, CTR points at the ask, and cost per result and ROAS judge the whole ad. None of the 6 can say what was on screen when viewers left, because a column holds a count. Read the ads at both ends of your ranking with Playhead, beside their numbers, and the difference between a 28 per cent hook rate and a 12 per cent one becomes a thing you can see and brief. It costs nothing on the free plan and $19 a month on Creator.
Common questions
What is a good hook rate for Meta video ads?
Meta publishes no benchmark for hook rate, because hook rate is not a Meta metric. Hook rate is 3-second video plays divided by impressions. Compare an ad with your own ads in the same account, placement and objective, not with a number from another brand.
How do you calculate hold rate?
Hold rate is ThruPlays divided by 3-second video plays. Meta counts a ThruPlay when a video plays for 15 seconds, or to 97 per cent of its length when it is shorter. So on an ad under 15 seconds, hold rate is the share of hooked viewers who watched to the end.
What does a creative analytics platform do?
A creative analytics platform connects to your ad accounts, pulls the metrics for each creative, and groups creatives by tags such as format or hook, so you can see which kind of ad performs. What it reports are counts from the ad platform, which say where viewers left and not what the ad showed.
Can AI analyse why a video ad works?
AI can read the video of an ad and write down what happens at each second: the hook, the beats, the claims, the cuts and the first appearance of the product. Playhead does that from a link. AI cannot tell you the ad's spend or ROAS from the video, because a video file holds neither.
Is CTR (link) the same as CTR (all)?
No. Meta defines CTR (link click-through rate) as link clicks divided by impressions. Meta defines CTR (all) as clicks (all) divided by impressions, and clicks (all) counts every kind of click on the ad, not only link clicks. So CTR (all) is never lower, and it says less about the ask.