For TikTok Shop sellers, affiliates and brands
TikTok Shop analytics: the free metrics
TikTok Shop analytics is free inside Seller Center, under Data Compass, and in TikTok Studio for creators. TikTok defines GMV as price times items sold, plus shipping fees, minus seller promotions and platform co-funding. GPM is the GMV earned for every 1,000 views, CTR is clicks out of impressions, and CTOR is orders out of clicks. Those numbers describe your own shop only. To learn from a competitor, watch the shoppable videos that sell for them and write down what each one does, second by second, which is the step Playhead does from the video's link.
Published 8 min read
The short version
- TikTok Shop's own analytics are free: Data Compass in Seller Center has 4 areas, Shop Analytics, LIVE Diagnosis, Product Performance and Product Recommendations.
- TikTok defines GMV as price x items sold + shipping fees - seller promotions - platform co-funding. It is not the money that reaches you.
- GPM is GMV for every 1,000 views. A video with 50,000 views and $400 of GMV has a GPM of $8.
- Seller Center shows your own shop. For a competitor, the evidence is the videos that sell for them, and those are public.
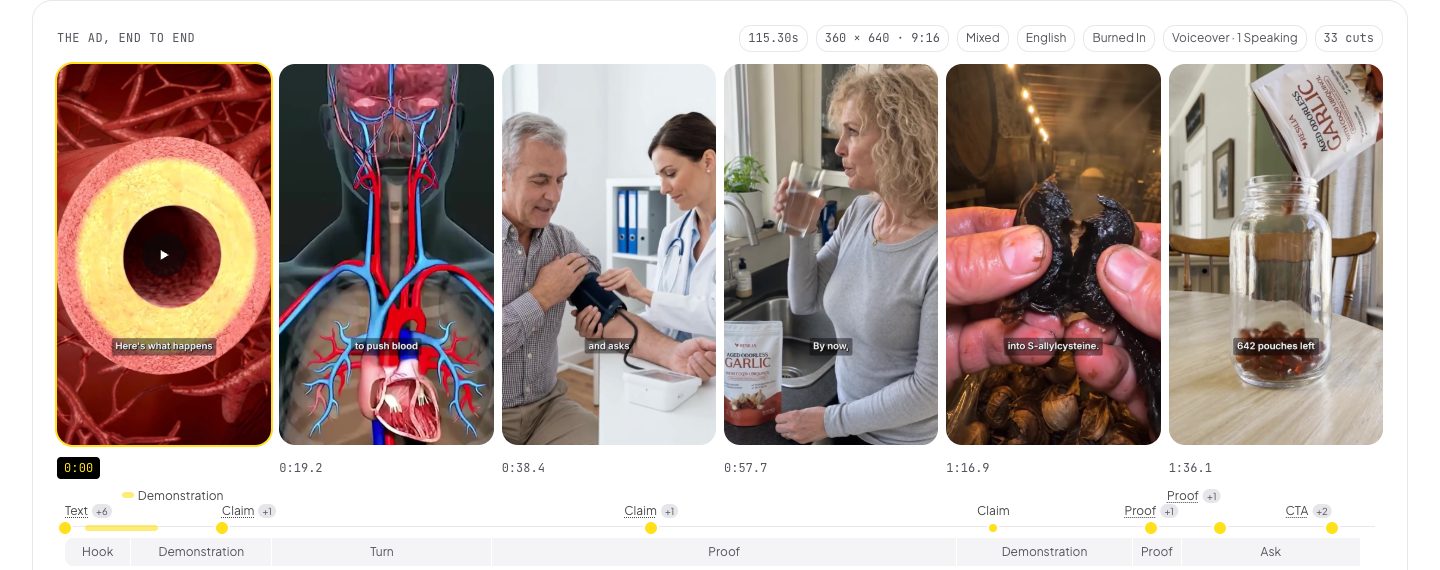
- Playhead reads a TikTok video from its link and names the hook, the beats, the claims and the first product second. It is free for 50,000 credits a month.
What is on this page and on no other
Every page about these products carries the same prices and the same feature lists. These are the facts this one produced itself, and how each one was made.
TikTok's own pages define 3 money figures for a shop and they are 3 different numbers: GMV, gross revenue and settlement. Settlement = GMV - total fees + total adjustments.
Of the 7 metrics a seller reads most, 5 have a definition on a TikTok page and 2 do not: TikTok defines GMV, GPM, CTR, CTOR and conversion rate, and prints no formula for AOV or for a visitor.
TikTok gives CTOR 2 definitions: orders per ads product page view in the video report, and orders per click on a live product ad in the livestream report.
Where TikTok Shop analytics lives, for free
Three places, and all of them show your own shop.
| Where | Who it is for | What it shows |
|---|---|---|
| Seller Center, Data Compass, Shop Analytics | Sellers | The key numbers of the shop, AOV among them, with detail pages for LIVE, videos and the product card |
| Seller Center, Data Compass, Product Performance | Sellers | How each product performs, one product at a time |
| Seller Center, Shop Tab and Search Analytics | Sellers | GMV, impressions, conversion rate and items sold from the Shop Tab and search |
| TikTok Studio, TikTok Shop for Creator | Creators and affiliates | GMV, direct GMV, items sold, CTR, CTOR and watch GPM, after each LIVE and over a date range |
The metrics that matter, with TikTok's own formulas
Five that TikTok defines, and one it leaves to you.
| Metric | TikTok's definition | What it tells you |
|---|---|---|
| GMV | Price x items sold + shipping fees - seller promotions - platform co-funding | How much buyers spent. Not what reaches your bank |
| Settlement | GMV - total fees + total adjustments | What reaches your bank |
| GPM | The GMV generated for every 1,000 views | How much one view of a video or a LIVE is worth |
| CTR | Impressions that resulted in a click, out of all impressions | Whether the video makes people tap the product |
| CTOR | Orders per product page view, or per click on a live product ad | Whether the product page closes the sale |
| Conversion rate | The share of unique page views that result in sales | The whole path from view to order |
| AOV | Not defined on these pages. GMV divided by orders is the ordinary arithmetic | How much one order is worth |
Read CTR and CTOR together. A video with a high CTR and a low CTOR makes people curious and then loses them on the product page: fix the page, the price or the reviews. A video with a low CTR and a high CTOR sells to the few who tap: fix the first seconds of the video.
GPM is the number to compare videos on. Views differ from video to video, and GMV follows views. GPM divides that out. A video with 50,000 views and $400 of GMV has a GPM of $8. A video with 200,000 views and $1,000 of GMV has a GPM of $5, so the smaller video sells better per view.
The definitions are on TikTok's own pages: Shop Analytics, Shop Tab and Search Analytics, Key Metrics to Observe and About Ads Metrics in Seller Center.
- Areas of Data Compass
- 4
- Money figures TikTok defines
- 3
- GPM of 50,000 views and $400 GMV
- $8
- What Seller Center costs
- $0
How to study the videos that sell for a competitor
Seller Center stops at your own shop. The videos do not.
Nobody can open a competitor's Seller Center. What is public is their shoppable videos: the ones on their own account, and the ones affiliates make for them. Those videos are the part of their funnel you can study, and the part your own GPM and CTR depend on most.
The work is the same every time. Open the video, pause at each cut, write down the first second the product is in frame, the claim on screen, when the price shows, and how the video asks for the tap. A reader does that from the link.
Collect the videos
Find the videos that sell the competitor's product in the TikTok app: on the brand's own account, and from affiliates who tag the product. Copy the links of the ones with the most views, and one or two with the fewest.
Read them as one set
Paste up to 10 links into Playhead as one set. Each video is read blind to the others, and the set is stacked into one comparison with the same fields.
Compare the rows
Read when the product first shows, the hook type, the order of the beats and which claims are on screen. Where the top videos agree and the weak ones do not, you have the pattern.
Test it against your own numbers
Film a video with the pattern, then read its CTR, CTOR and GPM in Seller Center or TikTok Studio beside your older videos.
The verdict
Start with the free analytics TikTok already gives you: Data Compass for sellers, TikTok Studio for creators, and the 5 metrics TikTok defines, GMV, GPM, CTR, CTOR and conversion rate. Compare videos on GPM, not on GMV. Then turn to the one thing Seller Center can never show: why a competitor's video sells. That evidence is public in their videos, and Playhead reads up to 10 of them in one set, free for 50,000 credits a month.
Common questions
How do I see my TikTok Shop analytics?
Sellers open Seller Center and go to Data Compass, where Shop Analytics shows the key numbers of the shop, with detail for LIVE, videos and the product card. Creators open TikTok Studio, then TikTok Shop for Creator, then Performance data, for GMV, CTR, CTOR and watch GPM over a date range.
Is there a free TikTok Shop analytics tool?
Yes. Seller Center and its Data Compass come with every TikTok Shop seller account at no cost, and TikTok Studio does the same for creators. Both show your own numbers only. To read a competitor's videos, Playhead is free for 50,000 credits a month.
What is GPM on TikTok Shop?
GPM means GMV per mille: the GMV generated for every 1,000 views of a video or a LIVE. A video with 50,000 views and $400 of GMV has a GPM of $8. GPM is the fair way to compare two videos that got different views.
How is GMV calculated on TikTok Shop?
TikTok Seller University defines GMV as price times items sold, plus shipping fees, minus seller promotions, minus platform co-funding. GMV is what buyers spent. Settlement, which is GMV minus total fees plus total adjustments, is what reaches the seller.
Can I see a competitor's TikTok Shop analytics?
No tool can open a competitor's Seller Center. What is public is their shoppable videos. Collect the videos linked to their product and read them as a set in Playhead, which names the hook, the beats, the claims and the second the product first shows in each one.